Research Areas
Explore how integrating spatial analysis with flow cytometry can uncover new dimensions of CAR T cell biology.


| 4 min read
Immunai has signed three major pharma deals in six months. The reason keeps coming back to the same thing: data that cannot be replicated in a single R&D cycle.

| 4 min read
Single-cell technologies now generate vast biological detail, but turning that detail into validated clinical decisions remains the hard part.
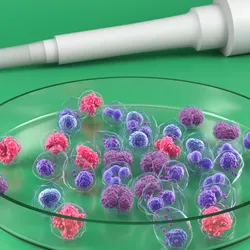
Building better 3D cell cultures starts with mastering one of the laboratory’s most fundamental techniques: pipetting.

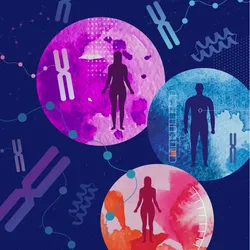
| 6 min read
As in vivo CAR T gains momentum, developers are finding new ways to make ex vivo manufacturing faster, more reproducible, and scalable.

| 4 min read
FDA approvals and complete responses letters, job cuts, a new FDA commissioner nomination, and more led the news this week.

Learn how biologically relevant 3D human tissue models can reveal organ-specific toxicity earlier and support more informed safety assessment.
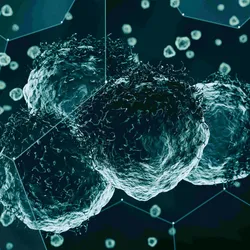
| 3 min read
The new approach combined digital pathology with spatial proteomics to uncover the secrets of metastasis and personalized treatment options.

| 6 min read
A new AI analysis of a negative Alzheimer's trial raises questions about whether conventional clinical trials are missing patients who could still benefit from treatment.

| 3 min read
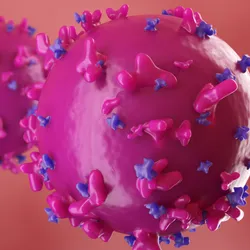
Scientists showed that a trio of medications successfully cleared the virus in a rhesus macaque infant model. Clinical testing in human infants could move quickly.
Popular Topics


Multimedia
| 1 min read
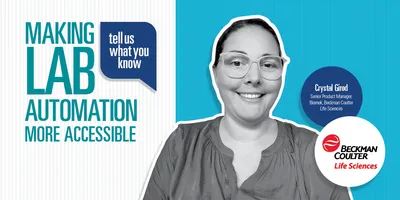
Explore how advances in liquid handling are making automation more accessible, flexible, and practical for modern labs.

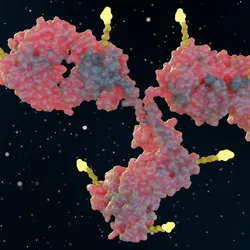
Explore how integrated cell-based assays reveal the mechanisms that drive antibody-drug conjugate activity and inform candidate selection.

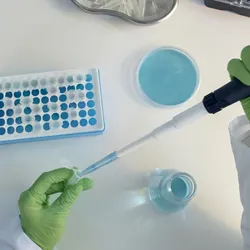
Repetitive pipetting can strain the hands, wrists, shoulders, and neck, making ergonomics an important part of efficient liquid handling.