| 3 min read
A biosciences expert at Malvern Panalytical explains how tracking several parameters can reveal protein instability while there is still time to act
| 4 min read
Samsung Biologics' Seahee Kim explains where patient-derived organoid data earn regulatory weight and where they still fall short
| 2 min read
Agreement expands collaboration between ProBio's biologics discovery capabilities and AbTis' site-specific antibody-drug conjugate technologyIndustry Perspectives

| 4 min read
Trusted NGS chemistries from Takara Bio now optimized for firefly® automated workflows
| 3 min read
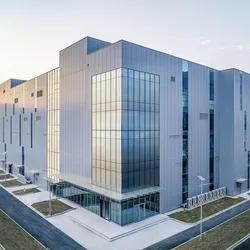
ProBio successfully completes the NMPA Pre-Approval Inspection at its Nanjing biologics facility, validating GMP readiness for commercial manufacturing.

| 6 min read
MCP and MHS promise to solve lab integration at last, but regulated environments demand more than connectivity before they can trust the results.

| 5 min read
Labs generate more analytical data than ever, but real-time access remains elusive. A purpose-built data pond may be the missing link.
| 5 min read
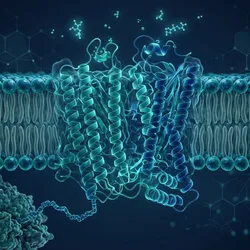
Three keynotes at GSK Stevenage in November make the case that AI has sharpened, not settled, the hardest problems in protein sciences drug discovery
| 4 min read
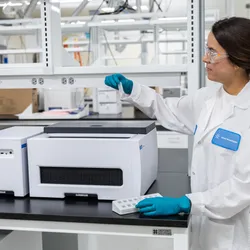
Enzymatic ligation may cut synthesis waste by nearly an order of magnitude, and Agilent's Boulder lab now puts that potential to a manufacturing test
| 5 min read
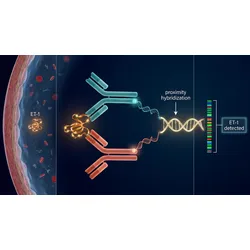
New data show Olink PEA matches ELISA for active ET-1 in intracoronary samples, offering a validated path to multiplex biomarker profiling in CAD research
| 4 min read
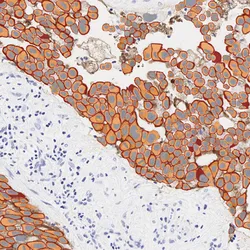
Imagene AI's quantitative pathology and CellCarta's CDx infrastructure offer biopharma sponsors one path from AI biomarker assay to regulatory submission
| 6 min read
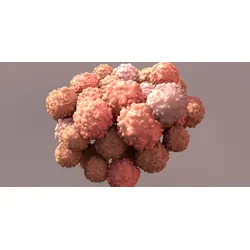
As 3D cell models advance toward mainstream use, the field must learn to work with biological variability rather than against it.