Discover how analyte properties can guide column selection and help determine the most effective chromatographic approach.

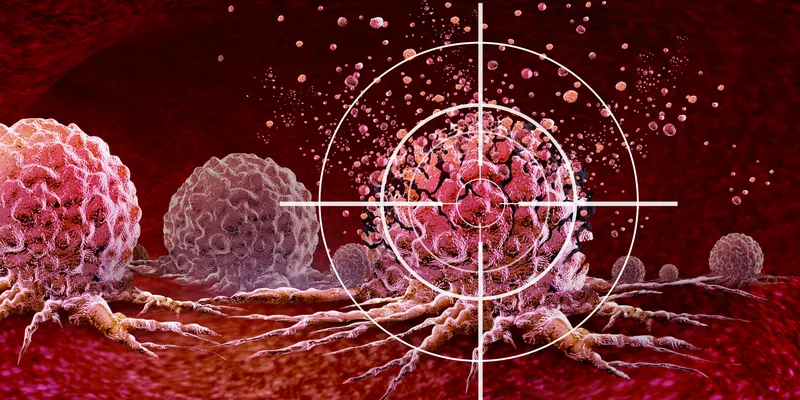
Researchers are uncovering new ways to attack some of cancer’s most elusive drivers.


Learn the key assay design principles and workflow considerations that help support robust, scalable, and reliable high-throughput screening campaigns.

Infographics
Learn how upstream analytical strategies can improve AAV yield, quality, and process efficiency.

Discover how rapid, single-particle mass photometry enables frequent empty and full capsid analysis throughout downstream processing.

Rapid DNA-to-mRNA workflows help scientists keep pace with rapidly evolving cancer through personalized vaccines.


Linking genetic, clinical, and real-world data enables a longitudinal view of kidney disease and supports therapeutic development.

A streamlined analytical strategy supports reliable plasmid and mRNA quality assessment at every mRNA production stage.


Discover how supercritical fluids expand chromatographic capabilities across diverse analytical challenges.


With diverse emerging modalities and innovative delivery strategies, RNA therapeutics are tackling complex diseases and unmet medical needs.
Learn how various 3D cell culture systems differ in design, function, and application in biomedical research.


In a discovery journey full of twists and turns, connecting data and collaborating across disciplines keeps progress on track.