Geographic atrophy (GA), the advanced late-dry form of age-related macular degeneration (AMD), progresses silently toward the fovea along paths that only become visible once irreversible photoreceptor loss has occurred. Approved complement inhibitors pegcetacoplan (Syfovre, Apellis Pharmaceuticals) and avacincaptad pegol (Izervay, Astellas Pharma) slow structural expansion by roughly 14 to 21 percent at 12 months in Phase 3 trials, measured by lesion area on optical coherence tomography (OCT), but neither stops the disease. Which patients will progress most rapidly, and in which direction, remains a question that OCT-based endpoints cannot answer.
A study published in Expert Review of Ophthalmology offers evidence that retinal apoptosis imaging can detect active disease before structural loss becomes visible on OCT. Novai announced the retrospective exploratory analysis, which used data from the Phase 2a DARC trial (ISRCTN10751859) to show that the company's Detection of Apoptosing Retinal Cells (DARC) imaging technology outperformed three established OCT biomarkers in predicting the future direction of macular atrophy growth.
Detecting retinal cell apoptosis before OCT can
DARC detects phosphatidylserine (PS) externalization, a molecular signal of cell stress that appears before visible structural damage, making it biologically distinct from imaging tools that register atrophy only after retinal tissue is lost. In healthy retinal cells, PS stays confined to the inner plasma membrane leaflet by ATP-dependent flippases; when cells enter stress or apoptosis, flippase activity falls and scramblase activity rises, translocating PS to the outer leaflet where it becomes accessible to probes. ANX776, a fluorescently labeled Annexin A5 protein, binds externalized PS with high calcium-dependent affinity; given intravenously, it reaches the retina, a tissue suited to in vivo fluorescence imaging because of the eye's optical transparency, where it labels stressed and dying cells.
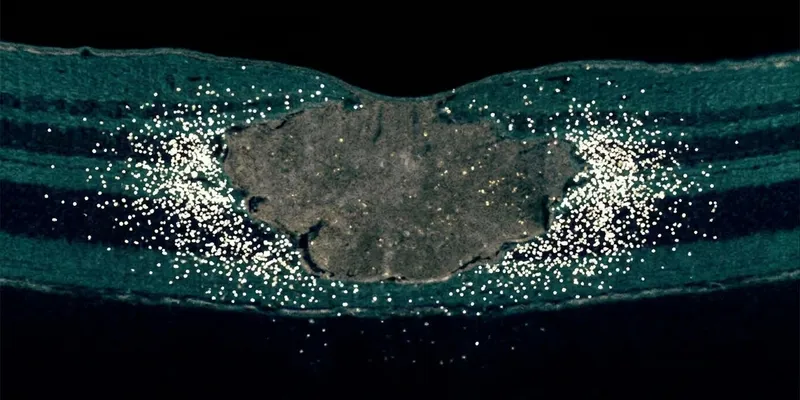
A confocal scanning laser ophthalmoscope images the labeled retina, and an AI-powered algorithm maps the resulting fluorescent spots, each representing a single apoptotic or stressed cell. The DARC system has demonstrated single-cell sensitivity in Phase 2 imaging: a convolutional neural network-aided algorithm achieved 97 percent accuracy and 91.1 percent sensitivity classifying individual DARC-labeled spots against manual graders. In a glaucoma cohort from the same Phase 2a trial, a higher baseline DARC count significantly predicted which patients would develop OCT-defined retinal nerve fiber layer thinning at 18 months, establishing an early precedent for DARC as a subclinical disease biomarker.
DARC outperforms three OCT biomarkers for directional atrophy prediction
Baseline DARC measurements showed a stronger association with the future directional growth of macular atrophy than the three established OCT biomarkers against which they were compared. The published analysis is a retrospective exploratory study that applied an angular plot framework to archived Phase 2a DARC trial data (ISRCTN10751859), quantifying the directional distribution of imaging signals around existing atrophy lesions to determine which signal best predicted the angular sector where GA expanded during follow-up. Research was conducted at Imperial College London.
The three OCT comparators each capture a different dimension of retinal tissue status near the GA margin: ellipsoid zone (EZ) loss and EZ-retinal pigment epithelium (RPE) difference measure disruption at the photoreceptor-RPE junction, while hyperreflective foci (HRF) density reflects inflammatory or degenerative activity in the outer retina. Each is well established in the imaging vocabulary that retina specialists and AMD trialists use to assess disease state and predict progression. Against all three, DARC signals provided directional information that structural imaging alone did not capture:
- Stronger directional association: Baseline DARC measurements associated more strongly with the future directional growth of macular atrophy than EZ loss, EZ-RPE difference, or HRF density
- Perilesional signal detected: DARC signals appeared beyond the visible margins of existing atrophy lesions, suggesting detection of stressed photoreceptors before structural damage registered on OCT
- Directional, not just areal: The angular plot method enabled directional prediction of progression, a distinction that lesion-area measures alone cannot provide
The Phase 2a study's small sample, absence of a prospective comparator arm, and retrospective design mean the findings require replication before DARC can be used clinically or incorporated into trial stratification. Prospective validation is ongoing in the DAB trial (ISRCTN22122298), a Phase 2 exploratory study at the ICORG Clinical Trials Unit, Western Eye Hospital, London, enrolling 40 people with treatment-naive wet AMD to evaluate DARC as a predictive macular atrophy biomarker during anti-VEGF therapy.
Why a directional macular atrophy biomarker is needed in GA trials
GA trials require large sample sizes and long observation windows because lesion-area growth rates, the primary OCT endpoint in the OAKS, DERBY, GATHER1, and GATHER2 trials, vary widely between patients, with rates below 2mm² per year common even in advanced disease. A directional macular atrophy biomarker that identifies which patients face the fastest progression trajectories could enable trials to enrich for high-risk populations, reducing sample size requirements and study duration. In clinical practice, no validated tool yet identifies which people with GA are most likely to experience foveal involvement and central vision loss, the threshold at which treatment benefit becomes most meaningful.
Standard-of-care retinal imaging, including spectral domain OCT, fundus autofluorescence (FAF), and near-infrared reflectance, delineates GA lesion boundaries precisely but cannot resolve disease activity at the cellular level. DARC fluorescent spots beyond the visible edge of existing lesions, in tissue appearing structurally intact on OCT, suggest the technology detects the perilesional apoptotic front: the zone of photoreceptor stress that precedes complete structural loss. Pinpointing that front, and its angular distribution, is the information the current imaging landscape cannot provide.
M. Francesca Cordeiro, Founder and CEO of Novai, Chair of Ophthalmology at Imperial College London, described the potential significance for treatment decisions. "The finding that DARC could provide a window into active disease, including where that disease activity is occurring, at an earlier stage addresses a major unmet need in geographic atrophy," Cordeiro said. "By identifying ongoing cellular activity before irreversible structural loss becomes established, DARC has the potential to identify patients at greatest risk of progression and central vision loss, when there may still be an opportunity to intervene."
How does DARC compare to established GA imaging tools?
DARC operates at the level of individual apoptotic retinal cells, placing it in a biologically distinct category from structural and metabolic imaging modalities currently used in GA management and trials. Spectral domain OCT, FAF, and near-infrared reflectance each detect tissue-level changes after atrophy is underway; none can label the apoptotic activity DARC captures at the single-cell level before structural consequences are measurable.
| Imaging modality | Biological signal detected | Current use in GA | Pre-structural detection |
|---|---|---|---|
| Spectral domain OCT | Structural: EZ, RPE, choriocapillaris layers | Standard of care; primary trial endpoint | Not possible; detects loss after it occurs |
| Fundus autofluorescence (FAF) | Lipofuscin accumulation in RPE | Lesion delineation and perilesional pattern analysis | Perilesional patterns may indicate future growth |
| Near-infrared reflectance | RPE and photoreceptor reflectance | Complementary to FAF in multimodal imaging | Limited; not designed for pre-structural activity |
| DARC (Novai) | Individual apoptotic or stressed retinal cells via Annexin A5 fluorescence | Phase 2 trial data; retrospective study published 2026 | Detects apoptosis beyond visible lesion margins |
OCT and FAF are embedded in regulatory submissions and existing treatment protocols in ways that DARC, at Phase 2, is not. Introducing DARC as a stratification tool or exploratory endpoint would require prospective evidence from the DAB trial. Emerging GA treatment approaches, including gene-based modalities, face the same patient-selection gap that a validated directional macular atrophy biomarker could help address.
Macular atrophy biomarker imaging moves toward the clinic
Phase 2a data showing DARC outperforms OCT biomarkers in predicting directional GA growth represent an early but promising step toward a validated cellular-level macular atrophy biomarker. DARC's key advantage is detecting apoptotic retinal cells beyond existing lesion margins before structural damage appears on OCT, a capability current standard-of-care imaging does not provide. Positive DAB trial data would position DARC as a candidate biomarker for GA clinical trials, with potential applications in patient stratification across the expanding landscape of geographic atrophy therapies.
This article is based on a press release issued by Novai and was produced under Drug Discovery News' AI Editorial Guidelines.